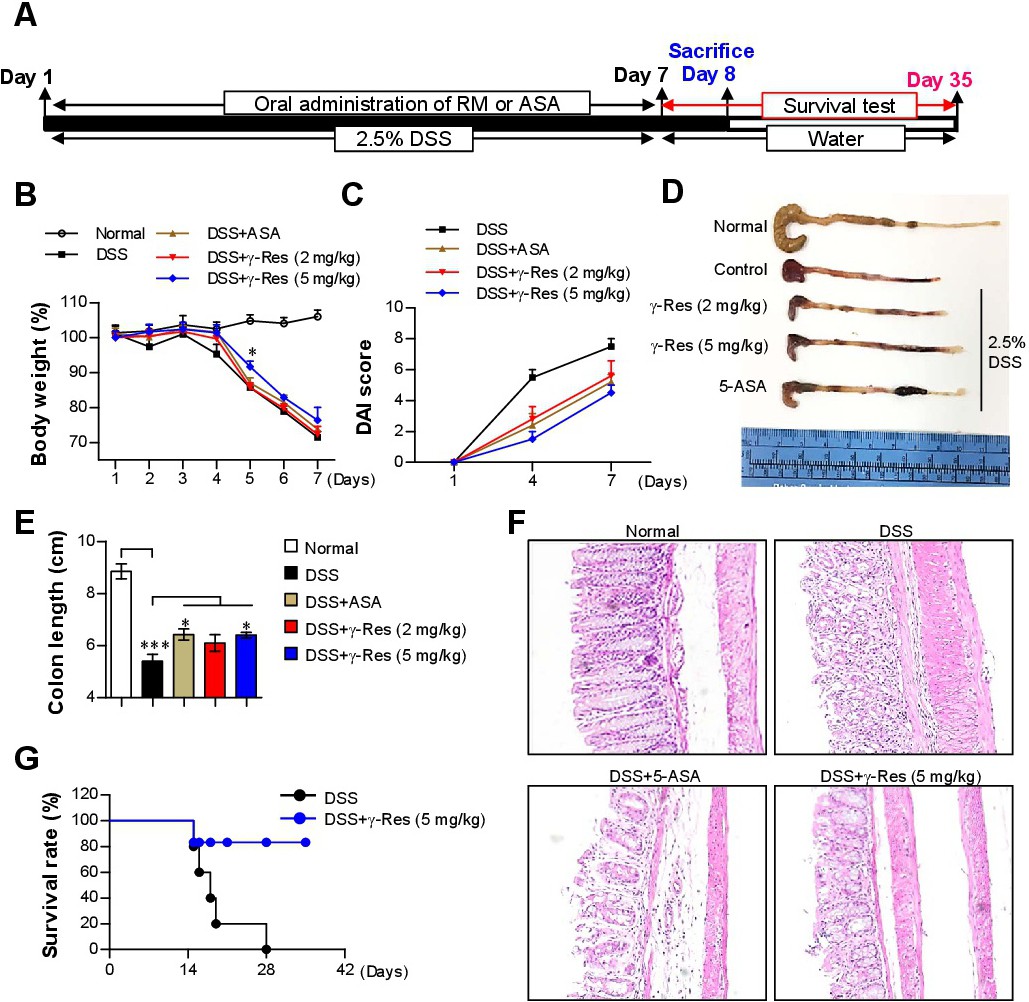
Fig. 11. Oral administration of γ-Res attenuated the clinical sign of colitis and macroscopic signs of inflammation in the colon tissue. A) Schematic diagram of the γ-Res treatment and induction of the colitis mice model via DSS. Details regarding this experiment are provided in the Methods section. B) Percentage change in body weight. C) DAI score. D) Representative photographs showing the colon tissue from each group. E) Changes in colon length. The bar graph shows the means ± SD of 5 mice per group. *p<0.05, or ***p<0.001. F) Representative histological images of the large intestine. G) Comparison of the survival rate was performed with only DSS and DSS + γ-Res 5 mg/kg. Percentage survival data of n = 5 mice per group. All mice drank water containing 2.5% DSS for 7 days and then normal water.